Friday 20th October 2017 at the Hungarian Railway History Park
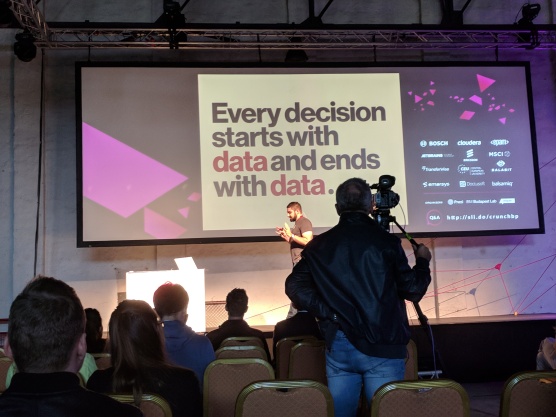
I decided to attend CRUNCH 2017 earlier this year when I was working in data engineering and it was the first data engineering conference I found in Europe. Turns out it was a great conference – a good mix of talks, interesting venue, well organised with great food and fun people. I just filled out the feedback form and there wasn’t much I could think of for them to improve.
There’s another conference – AMUSE – A UX conference that takes place in the same venue at the same time. I didn’t attend of the UX talks, simply because I was in the data talks all day but I did have look at their schedule and some of the materials they produced and it looks pretty good too. If I’d had a gap I’d have gone alone and had a look.
I wasn’t intending to write a blog post, so I didn’t take good enough notes yesterday. That’s a shame as the first day’s talks were great too, and there were a couple of talks by women. All the talks I attended today were by men. The conference intro told us that 20% of CRUNCH attendees were female, with 50% female for AMUSE.
Beyond Ad-Click Prediction
If you didn’t test it, assume it doesn’t work.
Dirk Gorissen runs a Machine Learning meetup in London (which is useful for me, as I’m setting one up in Sheffield) and his day job is working with autonomous vehicles. He talked about machine learning-related projects he does in his own time.
He’s worked on processing data from ground-penetrating radar to find land mines and developed drones to help conservationists keep an eye on Orangutans that have been released into the wild in Borneo. He also talked about some of the challenges autonomous vehicles face, from old ladies in wheelchairs chasing ducks, through remembering that cyclist that just disappeared behind that bus, to dealing with bullying humans.
There are many opportunities to work on projects that build on the same skills that you use to predict whether someone will click on an ad. He suggests finding a local meetup, getting involved with charities or using resources like Kaggle to find projects to inspire you.
Scaling Reporting and Analytics at LinkedIn
Premature materialization is premature optimisation – the root of all evil
Shikanth Shankar talked about a problem that we’ve all known, the tendency to have metrics that overlap and disagree (produced by different teams, typically!). LinkedIn faced this problem and built a system to produce metrics once and make available to all. He stressed the need for end-to-end thinking for systems as well as people.
Analysing Your First 200M Users
Avoid complexity at all costs
Mohammad Shahangian joined Pinterest as its eighth engineer, two years after leaving education, and was tasked with writing its data strategy. Today, Pinterest has a billion boards, two billion searches per month and makes two trillion recommendations per year. Guess he got it right!
He opens with a story about when Pinterest opened up its initial Twitter and Facebook signup to email, with the resulting influx of spam accounts that’ll be familiar to anyone who’s dealt with email signups! To figure out how bad the problem was, they hid the email signup UI from the webpage whilst leaving the form invisible but still present in the webpage – reasoning that humans would stop signing up by email, revealing the spammer’s scripts. Neat!
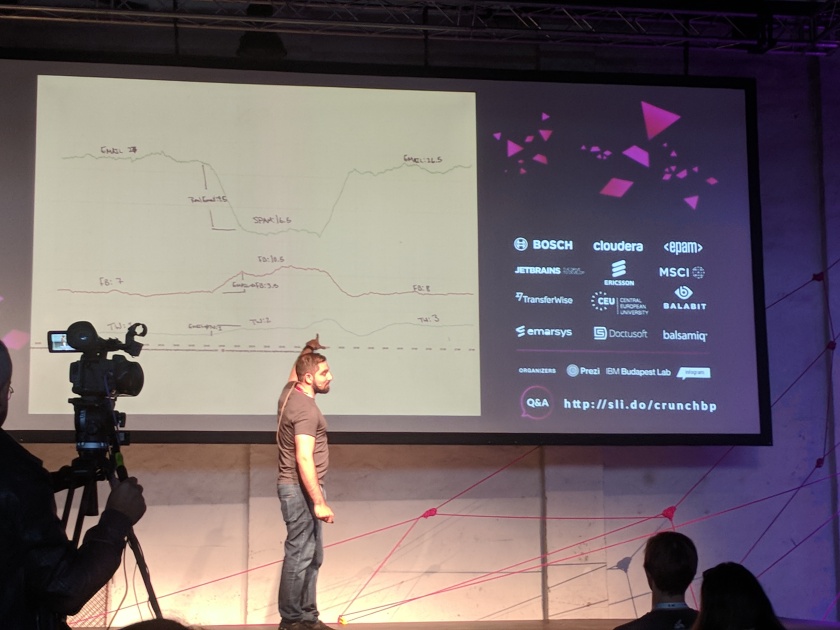
If you treat your userbase as one homogenous group, your userbase will become one homogenous group
He went on to talk about how Pinterest used data to figure out that “Pin” was a causing adoption problems in some languages, how segmentation really matters for decision making, the dangers of “linkage” (experiment tainting control), and how optimising everything for clicks can lead to missed opportunities or bad UX – think clickbait!
Science the Sh*t out of your Business
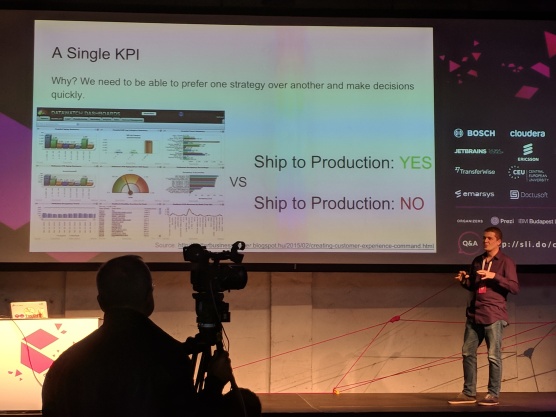
A single KPI is data-driven
Justin Bozonier is the lead data scientist at Grubhub and wrote Test-Driven Machine Learning. I knew him as @databozo after a couple of people I’d met yesterday had mentioned him.
He dove a little deeper into some of the maths behind measures, but also talked about how to interpret and use them. Is a dashboard full of charts or a single KPI that says ship or don’t ship data-driven? He argues it’s a single KPI, because a dashboard full of metrics needs a bunch of interpretation to drive a decision.
Justin also talked about false positives and shipping – shipping a feature that doesn’t have a positive impact doesn’t do any harm, and getting it out there has value in generating information and clearing the work out of the way. What about features that actually have negative impacts? Your analysis can show how much of negative impact is likely, helping with the choice to ship. Not shipping stuff that actually has a positive impact costs you the benefit you would have had if you’d shipped it earlier, so there’s a tension here.
Event-Driven Growth Hacking
Sustainable growth is data-driven
Thomas in’t Veld opens with the observation that small companies have had access to big analytics for about ten years.
He skims the architectural choices Peak has made to provide analytics for a mobile app-only brain training-style product, including the first time I’ve heard of a product called Snowplow for consuming and processing event data. He describes three “conditions for growth” in your company, including metrics and calculations to figure out whether your growth is sustainable (around whether or not your cost of acquiring customers is more or less than a customer’s expected lifetime value).
He finishes with five lessons learnt at Peak. Get the right culture, plan your event data carefully, validate early in the pipeline, deal with unit (not aggregate) economics and keep it simple.
AI in Production
Skin wins
Gio Fernandez-Kincade had me with “I’m going to talk about the things we don’t talk about”. Things like “How do you know that training data you crowdsourced is actually any good?” and “Does it work for our data?”.
He talked about his experience at companies like Etsy, picking out about something that I’ve seen everywhere I’ve had contact with companies involved with user-provided visual content – that skin wins. People will post up… inappropriate content and it’ll be a problem for the quality of your site, and for your data science!
He also talked about some of the difficulties of taking models into production – like how you integrate them with your existing systems? It may be fast enough to classify an image in 800ms, but when a query needs has 40 images to classify that time adds up. He hopes that within 5-10 years we’ll see production-ready AI systems where these kinds of concerns have been dealt with.
A new one for me, he talked about how asking users to complete multi-step processes before being allowed to register drives down registrations – and the “Big ****ing Button”, that is, a “Sign Up Here!” button – is pretty much unbeatable.
Lessons Learned from Teaching Data Science to over a Million People (slides)
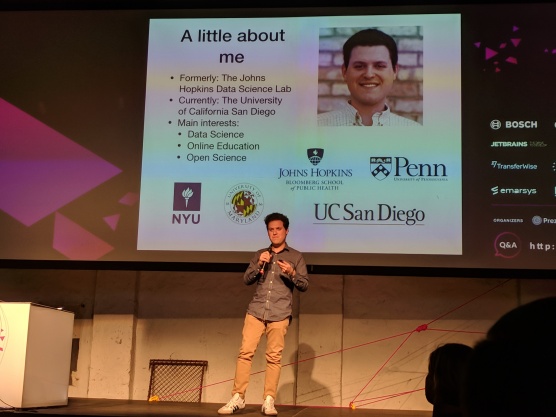
Sean Kross one of the brains behind a set of three data science courses on the Coursera site. The Data Science Specialization has had 4 million enrolments!
He shared some of his insights into why people like the courses. First, they give everything away for free. People can pay for a certificate, but they don’t have to. The materials are hosted on Github and the four scientists in Sean’s group have written fifteen books between them using the Leanpub publishing platform, which are also free with the option to pay.
The courses use real-world data. They partner with SwiftKey for datasets around swipe-based mobile keyboards and Yelp for a bunch of different data.
They run every course every month instead of following the semester-style pattern that’s common. That means that people can finish quickly if they want to, or if life gets in the way, they can drop out and pick up again next month.
Finally, each course leads into the next, instead of being a collection of unrelated study material.
There’s also a new fourth course, still under wraps, on the way!
How Deep is your Data?
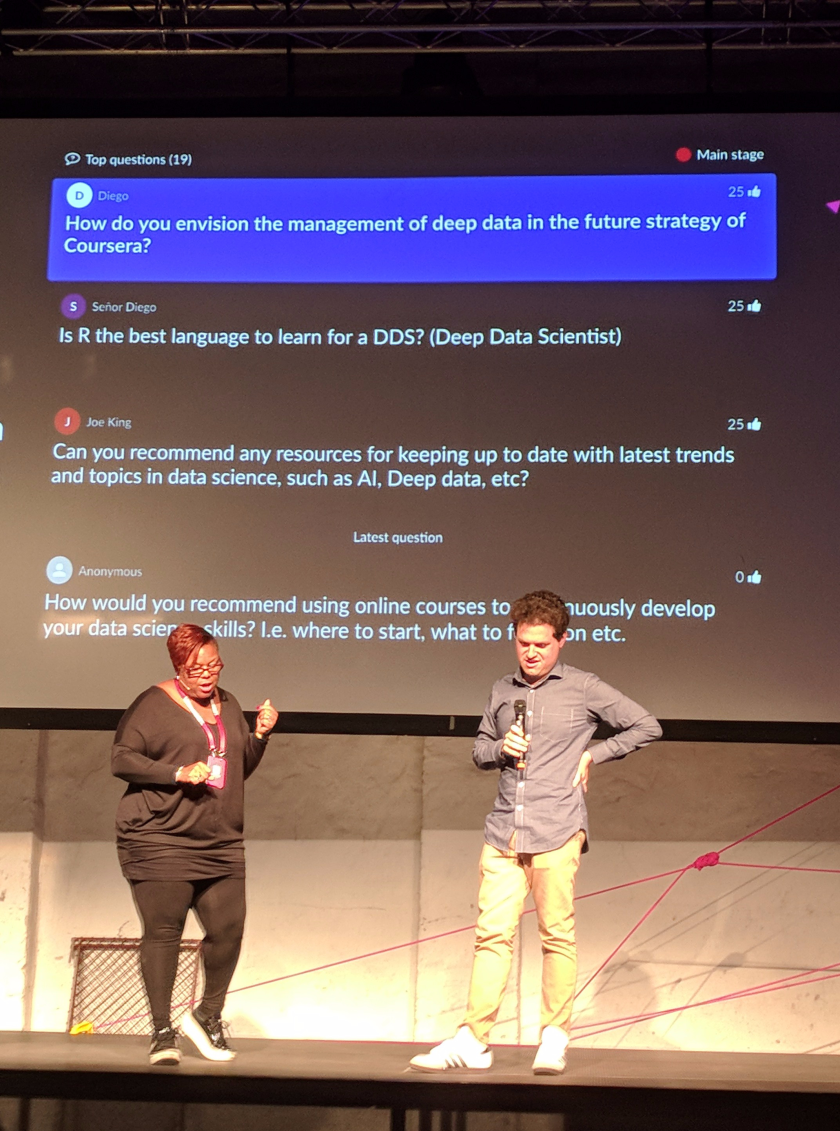
“Deep data” kept coming up in questions – none of the speakers knew what it was. Maybe it’s a new term will improve how we communicate data stuff and is just emerging at CRUNCH 2017. Or it’s another silly buzzword that we’ll be rolling our eyes at by CRUNCH 2018. My money’s on the latter!
The questions were asked using sli.do – we just hit up the URL and then could ask and vote for questions. After the talk, the top voted questions got asked. Easy.
Update: recordings and slide decks are available now.


